Section 1
Section 2
Section 3
Section 4
A 1
b w
n bnbnb
YY
MM
J
GGgg
0 Wind speed estimated Wind speed in m/s1 Wind speed obtained from anemometer Wind speed in m/s3 Wind speed estimated Wind speed in knots4 Wind speed obtained from anemometer Wind speed in knots
Q c
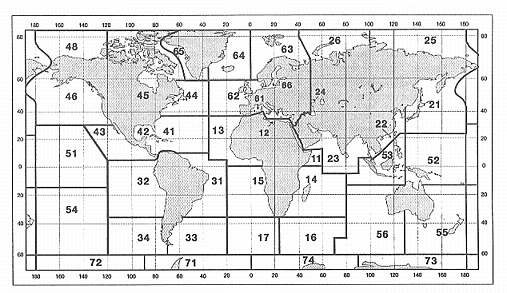
| Code figure | Latitude | Longitude |
| 1 | North | East |
| 3 | South | East |
| 5 | South | West |
| 7 | North | West |
Note: The choice is left to the observer in the following cases:
When the ship is on the Greenwich meridian or the 180th meridian (LoLoLoLo = 0000 or 1800 respectively):
Qc = 1 or 7 (northern hemisphere) or
Qc = 3 or 5 (southern hemisphere);
When the ship is on the Equator (LaLaLa = 000):
Qc = 1 or 3 (eastern longitude) or
Qc = 5 or 7 (western longitude).
L aLaLaLaLa
L oLoLoLoLoLo
Q l
Q t
Q dQx
Q
dd
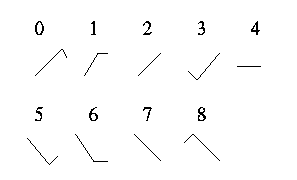
Code
figure
00	Calm
01	5-14
02	15-24
03	25-34

etc.	etc.

36	335-4
99	Variable, or all directions or unknown or waves
	confused, direction indetermininate
ff
s n
codefigure0 Positive or zero1 Negative
TTT
T dTdTd
UUU
P oPoPoPo
PPPP
a
Codefigure0 Incresing, then decreasing; atmospheric pressure the same or higherthan 3 hours ago1 Increasing, then steady;or increasing then increasing more slowly;atmospheric pressure now higher than 3 hours ago2 Increasing (steadily or unsteadily); atmospheric pressure now higherthan 3 hours ago3 Decreasing or steady, then increasing; or increasing, then increasingmore rapidly; atmospheric pressure now higher than 3 hours ago4 Steady; atmospheric pressure the same as 3 hours ago5 Decreasing, then increasing; atmospheric presure the same or lowerthan 3 hours ago6 Decreasing, then steady; or decreasing, then decreasing more slowly;atmospheric pressure now lower than 3 hours ago7 Decreasing (steadily or unsteadily); atmospheric pressure now lowerthan 3 hours ago8 Steady or increasing, then decreasing; or decreasing, then decreasingmore rapidly; atmospheric pressure now lower than 3 hours ago
ppp
T wTwTw
P waPwa
H waHwa
P waPwaPwa
P
(a) The sea is not calm (i.e. PwaPwaHwaHwahas not been reported as 0000)
(b) PwaPwahas not been
reported as //
(c) The station has the capability of accurately measuring instrumental
wave period in units of 0.1 second
H waHwaHwa
P
(a) The sea is not calm (i.e. PwaPwaHwaHwahas not been reported as 0000)
(b) HwaHwahas not been reported as //
(c) The station has the capability of accurately measuring instrumental wave period in units of 0.1 meter
Q d1
Q d2
k 2
Code
figure
0	No salinity measured
1	In situ sensor, accuracy better than 0.02 per mill
2	In situ sensor, accuracy less than 0.02 per mill
3	Sample analysis
z 0z0z0z0
z1z1z1z1
znznznzn
T 0T0T0T0
T1T1T1T1
TnTnTnTn
For negative temperatures, 5000 shall be added to the absolute value of
the temperature in hundredths of a degree Celsius.
S 0S0S0S0
S1S1S1S1
SnSnSnSn
k 6
Code
figure
0	Ship's motion removed by averaging. Ship's velocity
	removed by bottom tracking
1	Ship's motion removed by motion compensation. Ship's
	velocity removed by bottom tracking
2	Ship's motion not removed. Ship's velocity removed
	by bottom tracking
3	Ship's motion removed by averaging. Ship's velocity
	removed by navigation
4	Ship's motion removed by motion compensation. Ship's
	velocity removed by navigation
5	Ship's motion not removed. Ship's velocity removed by
	navigation
6	Doppler current profiling method not used.
7-9	Reserved
Note: Code figures 0, 1, 2 and 6 are also used
for drifting buoys.
k 3
| Code figure |
||
| 1 | Instantaneous | between H-1 and H |
| 2 | Averaged over 3 minutes or less | |
| 3 | Averaged over more than 3 minutes, but 6 at the most | |
| 4 | Averaged over more than 6 minutes, but 12 at the most | |
| 5 | Instantaneous | between H-2 and H-1 |
| 6 | Averaged over 3 minutes or less | |
| 7 | Averaged over more than 3 minutes, but 6 at the most | |
| 8 | Averaged over more than 6 minutes, but 12 at the most | |
| 9 | Vector or Doppler current profiling method not used | |
d 0d0
d1d1
dndn
Code
figure
00	Calm
01	5-14
02	15-24
03	25-34

etc.	etc.

36	335-4
99	Variable, or all directions or unknown or waves
	confused, direction indetermininate
c 0c0c0
c1c1c1
cncncn
Q P
Quality of the pressure measurement

Code
figure
0	Value within specified limits
1	Value outside specified limits
Q 2
Code
figure

0	Value within limits
1	Value outside limits
Q TW
Code
figure

0	Value within limits
1	Value outside limits
Q 4
Code
figure

0	Value within limits
1	Value outside limits
Q N
Code
figure

0	Good quality (several identical reports have been received)
1	Dubious quality (no identical reports)
Q L
| Code figure |
|
|---|---|
| 0 | The value transmitted at the beginning of the report is a reliable value (location made over two satellite passes) |
| 1 | The values at the beginning of the report are the latest known values (no location over the corresponding pass) |
| 2 | Dubious quality. The location was made over one pass only; a second solution is possible in five per cent of the cases |